Nobody publishes real pull rates, so this page does the next best thing:
it counts what actually came out of packs opened on camera, one rip at a time. It is one
person's luck, not the odds.
514packs opened on camera
378rip videos
245hit cards pulled
188rips that hit, of 374
50.3%hit rate per rip
2.1packs per hit card
Chase cards pulled Counts of cards, rarest tier first
1Mega Hyper Rare
2Hyper Rare
4Special Illustration Rare
52Illustration Rare
40Ultra Rare
87Double Rare
What we have opened
Ordered by hits, which is the question asked. That order is a count, not a
verdict: the kind with the most hits is usually the kind we opened most of, so every card
carries the rate and the rips it is over, at the same size, right underneath. Most hits is single pack. The best RATE over 12 or more answered rips is
blister at 100%.
Rips are videos, packs are packs, and
boxes are neither. An elite trainer box holds 9 packs and this channel films them one at
a time, so 63 elite trainer box rips are nothing like
63 boxes. Packs is packs ripped on camera. Boxes is a
floor: if pack 1 turns up in three videos of the same product and set then three boxes were opened. Across the kinds whose pack count is published, those boxes hold 160 packs between them and
the rips of them count 156. Those are two different quantities and neither is the other:
that difference is packs not opened on camera yet.
Best cardnothing from this one carries a guide value yet
The best cards, three ways
"Best" is not one thing. The first two land on the same card at the moment, which is not the usual case and will not stay true: they are
two different measurements and the ungraded top and the graded top come apart as soon as a cheaper card with a
strong graded price turns up. Ungraded figures are pricecharting.com's price guide value for an ungraded copy, read October 18, 2026. A guide value is computed across the sales PriceCharting tracks, which is a wider set of venues than any one marketplace. 2 cards of the 5,396 priced here are not listed by PriceCharting and keep their TCGplayer market price via TCGdex instead. PSA 10 figures come from pricecharting.com, read between Oct 13, 2026 and Oct 18, 2026, and are a different measurement from the ungraded guide value above.
The highest guide value among the 243 of 245 cards in the rip log that carry one. It came out of elite trainer box, at least 457 packs into the channel.
A different question from the one beside it, and it rests on a much
smaller set: 220 of the 245 cards in the rip log have a graded figure at all. Nothing here
has been graded. This is what the guide says a 10 sells for.
Guide value of every priced card out of it, over its 13 answered rips. At least is
load bearing: a card with no guide value counts as nothing in that sum, so the figure is a floor and can only
climb. Only kinds with 12 or more answered rips are eligible.
Does it matter which pack
The oldest superstition in the hobby, and this log can test it, because the rip
sheet records which pack out of the box each video opened. The best position with a real sample behind it is pack 6 at 69.2% over
26 answered rips, against 50.3% across every answered rip.
Hit rate by which pack out of the box it was, over the 312 answered rips that state a Pack number.
An empty frame is a pack number with fewer than 12 answered rips behind it: the sample is there, the reading is not.
The right hand end is not a later moment in one box. Pack 9 only exists inside products that hold nine packs, so
the columns are a different mix of products as you go right, and the thinning sample is the same fact said twice.
Which sets have been kind
Hit rate is the share of answered rips from that set that produced something
worth keeping. Sets with fewer than 12 answered rips do not get a number: at that
size it would be noise dressed up as a fact. Rips is every rip of that set, and where some of
them have no answer yet the cell says how many do, because the rate is only over those. Packs is
packs ripped on camera, from the rip log's own set by set breakdown, so a rip that opened two sets
charges each of them its own packs rather than both of them all of them.
186 of the 374 answered rips produced nothing worth keeping, which is
49.7% of them. That is the channel, not a bad patch: it is why it is called Garbage
Rips. The drawing is every run of the same result in a row, so you can see how long the bad ones actually go.
Every run of the same result in a row, counted over the 374 answered rips in upload order.
There are 88 dry runs and 89 hot ones, which is what a channel sitting near a coin flip looks
like: both sides are stacked at the short end and both have one long tail. The bars are counts of RUNS, not of rips.
Trubbish88 separate dry spells, the longest 7 rips, and the
commonest one is a single rip. Nothing in it, on to the next one.
What has actually come out
Counted from the Hit Card cell of the rip log, which is where the cards that came out are
written down by hand, so this is a separate tally from the hit rates above and the two will not
line up. A rip counts once per rarity however many cards of that rarity came out of it, so these are
counts of rips rather than of cards: 164 tags across 147 rips against
the 245 cards the log records, and the widest gap on one rip is 14 cards under 5 tags. That is on purpose: this band is about how often a rip produces each kind of card, and counting
one opening five times would let a single lucky box outweigh a month of them. The cards themselves are listed one
by one on the best pulls page. They are totals, not rates: a set
that gets opened more will show more of everything. A fuller log makes these counts more complete, not more predictive: they say what
came out of the packs we opened, never what will come out of yours.
73Double Rare
44Illustration Rare
31Ultra Rare
5Charizard
3Special Illustration Rare
3Gold / Hyper Rare
3Super Rare
2ACE SPEC Rare
Cold streaks and hot ones
The longest of each, and the rips they are made of.
Longest drought7 rips
Jul 19, 2026 to Jul 22, 2026, nothing worth keeping.
Every rip by the month it went up, split into what came out of it. The hatched part
of a column is the part of that month nobody has answered yet, so this is the coverage picture as well
as the run rate: it fills in from the bottom as the log is worked through.
Every one of the 378 rips, by the month it went up. The hatched part of a column is the part of that
month nobody has answered yet, which is why this drawing is also the coverage picture: 1 of the 9 months still has some, and the shortfall is 4 rips in total. As the log fills, the hatching goes and nothing else about this chart moves.
The counts and rates on this page are our own, measured from
the rip log, and you are welcome to reuse them under
CC BY 4.0
with credit to Garbage Rips 585. That covers the figures we counted, not the card names, prices or set data
beside them, which come from TCGdex, PriceCharting and the Pokemon TCG API.
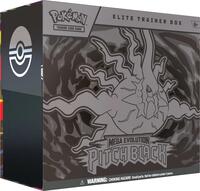
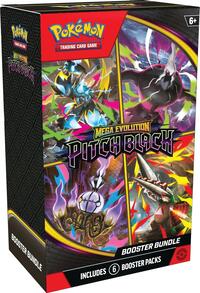
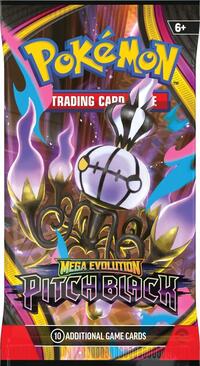 Single PackPitch Black shownMOST HITS
![Prismatic Evolutions Mini Tin [Jolteon], sealed](https://tcgplayer-cdn.tcgplayer.com/product/593456_200w.jpg)

![Pitch Black Single Pack Blister [Slowpoke], sealed](https://tcgplayer-cdn.tcgplayer.com/product/692955_200w.jpg)